
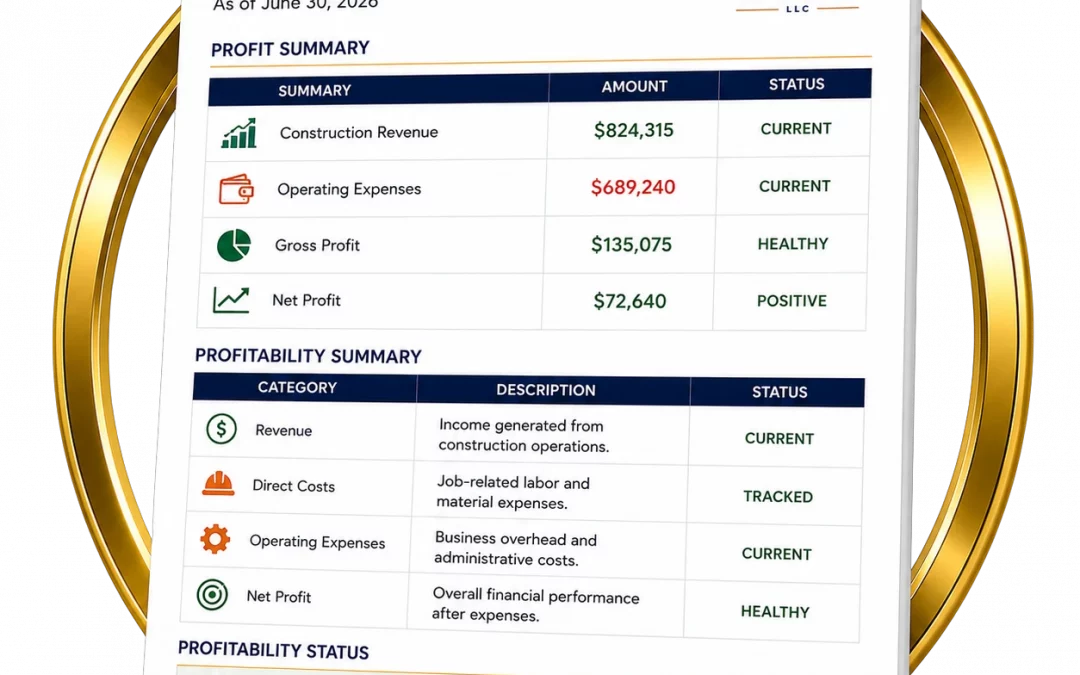
A Profit & Loss statement can tell you much more than whether revenue went up or whether there is money left at the bottom of the page.
Read correctly, it helps you understand how your construction business produced its financial result.
You can see how much revenue the business generated, what it cost to perform the work, how much remained after those job costs, what it cost to operate the company, and whether the business ultimately produced a profit.
That makes the Profit & Loss statement one of the most useful places to start when asking:
Is my construction business actually making money?
The key is to read the report as a sequence rather than jumping directly to one number.
1. Start With the Reporting Period
Before interpreting any numbers, look at the period covered by the Profit & Loss statement.
You might be reviewing:
- the current month;
- the current quarter;
- year to date;
- the previous year; or
- another clearly defined period.
The period matters because the numbers only make sense in the context of the activity they represent.
A single month may be affected by the timing of a large project, material purchase, billing event, or expense. A longer period can provide more context, but it can also hide changes that occurred recently.
Make sure you know exactly what period you are evaluating before deciding what the numbers mean.
2. Review Revenue
Revenue tells you how much income the business generated during the reporting period.
Start by asking:
How much revenue did the business generate?
Then compare that number with another meaningful period.
Did revenue increase?
Did it decrease?
Was the change expected?
What caused it?
For a contractor, the answer may involve the number of projects completed, project size, billing timing, change orders, the mix of work performed, or other business activity.
But revenue is only the beginning of the profitability story.
A construction company can generate more revenue and still become less profitable if the cost of producing that revenue increases faster than the revenue itself.
That is why the next section matters.
3. Review Direct Job Costs
Direct job costs are the costs associated with performing the work.
Depending on the construction business and how its accounting system is organized, these may include items such as:
- job labor;
- labor burden;
- materials;
- subcontractors;
- equipment costs; and
- other costs directly attributable to projects.
Look at the total direct costs for the period and compare them with the revenue those costs helped produce.
Then ask:
How much did it cost us to perform the work that generated our revenue?
If revenue increased, did direct costs increase at roughly the same rate?
Did they increase faster?
Were there unexpected labor, material, subcontractor, or equipment costs?
A company can be extremely busy and still struggle with profitability when the cost of completing the work consumes too much of its revenue.
4. Understand Gross Profit
Once direct job costs are subtracted from revenue, the amount remaining is gross profit.
In simplified form:
Revenue − Direct Job Costs = Gross Profit
Gross profit shows how much the work produced before the operating expenses of running the overall business are considered.
For example:
Suppose a contractor generates:
$1,000,000 in revenue
and incurs:
$750,000 in direct job costs
The resulting gross profit is:
$250,000
That $250,000 still has another job to do.
It must help cover the expenses required to operate the company.
5. Look at Gross Margin
Gross profit tells you the dollars remaining after direct job costs.
Gross margin helps you understand that result as a percentage of revenue.
Using the example above:
Revenue: $1,000,000
Gross Profit: $250,000
The gross margin is:
25%
That percentage becomes particularly useful when comparing financial performance across periods.
Suppose revenue increases from $1,000,000 to $1,200,000.
At first glance, that sounds positive.
But imagine gross profit increases only slightly, from $250,000 to $264,000.
The comparison would look like this:
| Financial Measure | Period 1 | Period 2 |
|---|---|---|
| Revenue | $1,000,000 | $1,200,000 |
| Direct Job Costs | $750,000 | $936,000 |
| Gross Profit | $250,000 | $264,000 |
| Gross Margin | 25% | 22% |
Revenue increased by $200,000.
Gross profit increased by only $14,000.
And gross margin fell from 25% to 22%.
The business got larger during the period, but it kept less gross profit from each dollar of revenue.
That deserves investigation.
The P&L has not yet told you why the margin changed. It has told you where to start asking questions.
6. Review Operating and Overhead Expenses
After gross profit, move down the P&L to the expenses required to operate the business beyond the direct costs of performing individual jobs.
Depending on how the business organizes its accounts, these may include expenses such as:
- office and administrative costs;
- insurance;
- software;
- professional services;
- rent;
- non-job-specific vehicle or equipment expenses;
- administrative payroll; and
- other overhead.
Ask:
What does it cost to operate the business beyond the direct costs of completing our jobs?
Then compare those expenses with previous periods.
Look for significant changes.
An increase is not automatically a problem. The business may have deliberately added staff, systems, equipment, or other capacity.
The more useful question is whether the overhead being carried by the company is appropriate for the financial performance the business is producing.
Strong job-level gross profit can still turn into weak overall profitability when operating expenses consume too much of it.
7. Find Net Profit
After direct job costs and operating expenses are accounted for, you reach the bottom-line result.
Net profit shows what remained from the business’s financial activity for the reporting period after the expenses reflected on the P&L.
If the number is negative, the business produced a loss for that period.
Don’t stop with:
“We made $X.”
Ask:
How did we arrive at that result?
Was net profit driven by:
- higher or lower revenue;
- stronger or weaker gross margin;
- changes in job costs;
- changes in overhead; or
- a combination of factors?
The bottom line tells you the result.
The sections above it help you understand how the business produced that result.
That distinction is Financial Visibility.


8. Compare Periods Instead of Reading One P&L in Isolation
One Profit & Loss statement gives you a financial result.
Comparisons give that result context.
A Construction Profitability Example
Consider two reporting periods:
| Financial Measure | Period 1 | Period 2 |
|---|---|---|
| Revenue | $1,000,000 | $1,200,000 |
| Direct Job Costs | $750,000 | $936,000 |
| Gross Profit | $250,000 | $264,000 |
| Gross Margin | 25% | 22% |
| Operating Expenses | $180,000 | $210,000 |
| Net Profit | $70,000 | $54,000 |
| Net Profit Margin | 7% | 4.5% |
If you looked only at revenue, Period 2 might appear better.
Revenue increased by 20%.
But the rest of the P&L tells a different story.
Direct job costs consumed more of that revenue.
Gross margin declined.
Operating expenses increased.
And net profit fell from $70,000 to $54,000.
The business did more work and generated more revenue, but produced less bottom-line profit.
That is why revenue alone cannot tell you whether the business is becoming more profitable.
The P&L helps reveal the relationship between the work being performed, what that work costs, what remains after those costs, and what it costs to operate the company.
When possible, compare the current period with a meaningful prior period and review:
Revenue
Is it increasing or decreasing?
Direct Job Costs
Are they changing in proportion to revenue?
Gross Profit
Is the business retaining more or fewer gross-profit dollars?
Gross Margin
Is the percentage improving, declining, or remaining relatively consistent?
Operating Expenses
Has the cost of running the company changed?
Net Profit
Is the business ultimately keeping more or less?
Then investigate the reasons behind meaningful changes.
The goal is not simply to label every increase as good or every decrease as bad.
The goal is to understand what changed and why.
9. Know What the P&L Cannot Tell You by Itself
A Profit & Loss statement is powerful, but it does not answer every financial question.
It can help you understand overall profitability for a period.
It cannot, by itself, fully tell you:
- which individual jobs are profitable;
- whether the business has enough cash available right now;
- whether customers are paying on time;
- whether the business has sufficient working capital;
- what the business owns and owes; or
- which customers or services are producing the strongest results.
Those questions require other financial information.
For example:
Job performance reporting helps you evaluate individual projects.
The Balance Sheet helps you understand the company’s financial position.
The Statement of Cash Flows and other cash information help explain how cash is moving through the business.
Accounts Receivable information helps you understand what customers owe and collection performance.
Financial Visibility comes from using the appropriate information for the question you are trying to answer—not expecting one report to answer everything.
Questions Your P&L Should Help You Ask
After reviewing your Profit & Loss statement, you should be able to ask better questions about the business.
For example:
Is revenue growing without a corresponding improvement in profit?
Are direct job costs consuming a larger percentage of revenue?
Is gross margin improving or declining?
Which job costs may be driving the change?
Has overhead increased, and why?
Is the business producing enough gross profit to support its operating expenses?
Why did net profit change from the previous period?
Do I need to investigate individual job profitability?
Does the business show a profit while cash still feels tight?
Does our current pricing support the margins the business needs?
These questions move you beyond simply receiving a financial report.
They help you use the report to understand what is happening and determine what you need to investigate next.
Keep Building Your Financial Visibility
If you haven’t yet established whether your construction business is profitable overall, start with:
If you want a practical review process to work through your own numbers, use:
And if your P&L shows that job costs or margins deserve closer attention, the next question may be:
If the business shows a profit but cash still feels tight, investigate:
If margins suggest that the work isn’t producing enough gross profit, continue with:
The purpose of reading your P&L isn’t simply to know what happened.
It is to build enough Financial Visibility to understand why it happened and what business question you need to answer next.
READY FOR MORE FINANCIAL VISIBILITY?
Get a Clearer View of Your Construction Business
If you’re not confident your financial reports are giving you the visibility you need, a Book Review can help identify where your financial information is clear, where questions remain, and what may deserve a closer look.