
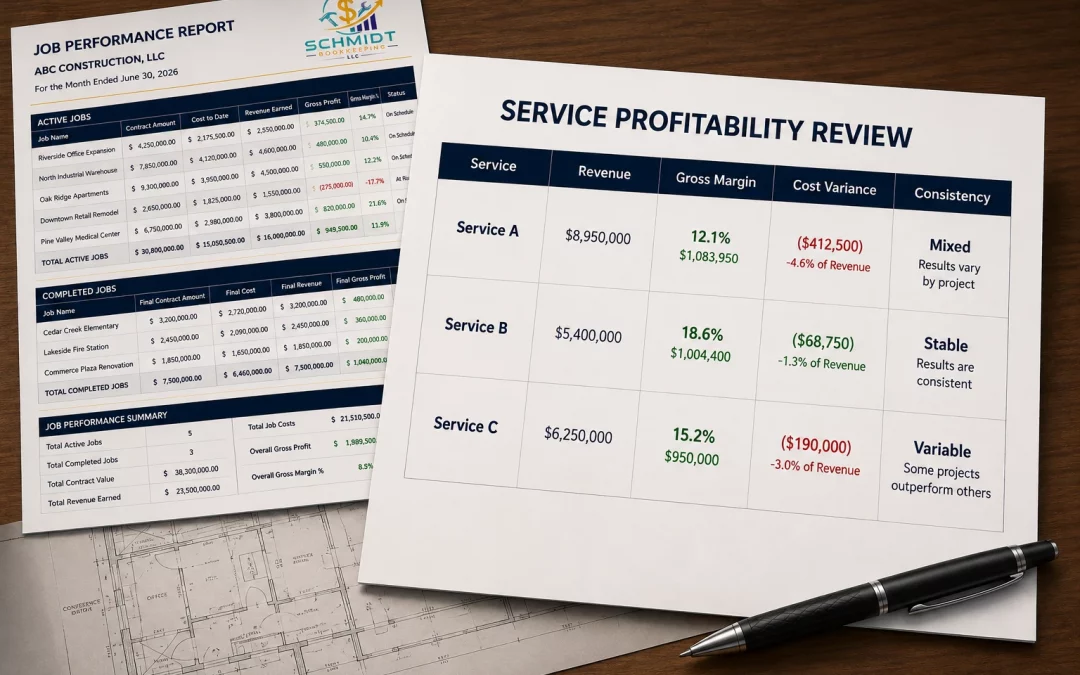
Some types of work can keep your company extremely busy.
The phone keeps ringing. Crews stay scheduled. Revenue keeps coming in. You may perform the same kind of work over and over because customers continue asking for it.
That can make the service feel like an important part of the business.
But activity does not tell you what that work is contributing financially.
One service may generate substantial revenue while consistently producing weaker Gross Margins, labor overruns, equipment costs, or significant cash demands.
Another may generate less revenue but produce stronger margins, perform closer to estimate, require fewer financial resources, and deliver more consistent results.
So the question is not simply:
Which service generates the most revenue?
The more useful question is:
Which types of work consistently produce the strongest financial results for my business—and which ones deserve improvement, less emphasis, or reconsideration?
Answering that question requires looking across multiple jobs and organizing their financial results by the type of work performed.
That creates another level of Financial Visibility.
The Busiest Service Is Not Automatically the Best Service
It is easy to associate activity with success.
If one service represents a large share of your schedule, keeps several crews working, and generates significant annual revenue, it may seem obvious that the business should pursue more of it.
But revenue and activity tell you only part of the story.
Suppose one type of work generates $1 million in annual revenue but regularly finishes below expected Gross Margin because labor runs over estimate and equipment costs are higher than anticipated.
Another service generates $600,000 but consistently produces stronger margins, performs close to estimate, and requires less financial capacity to complete.
Which service contributes more effectively to the business?
You cannot answer that from revenue alone.
You need to understand what the jobs within each service actually produce and what the business has to commit to produce those results.
The service that keeps you busiest is not automatically the service that contributes the most financially.
Define the Types of Work You Want to Compare
Before you can evaluate profitability by service, you need to decide what kinds of work you are actually comparing.
Those categories should reflect how your construction business operates.
Depending on the company, meaningful categories might include:
- remodeling;
- service work;
- tenant improvements;
- new construction;
- maintenance;
- installation;
- repair;
- other distinct types of work the company regularly performs.
Those are examples, not universal categories.
A specialty contractor may organize work differently from a general contractor. A remodeling company may need different categories from an electrical contractor.
The categories should use a consistent basis. Avoid mixing overlapping classifications—such as type of work, customer market, and project size—unless that distinction is intentionally part of the analysis.
The goal is to create categories that help you answer a business question.
If the categories are too broad, meaningful differences between types of work may disappear.
If they are too narrow, you may have too few comparable jobs to recognize a useful pattern.
The important thing is consistency.
If similar work is categorized differently from one project to another, service-level comparisons become less reliable.
Useful service profitability analysis starts with organizing comparable work consistently.
Evaluate a Service Across Multiple Jobs
One profitable job does not prove that a service is highly profitable.
One bad job does not prove that a service should be discontinued.
Individual construction projects can be affected by circumstances that may not repeat.
A job might perform poorly because of:
- an estimating mistake;
- unusual site conditions;
- rework;
- a difficult subcontractor;
- material price changes;
- scheduling problems;
- missed change orders;
- one-time labor inefficiency.
Those issues matter when evaluating the individual project.
But they may not represent the normal financial performance of the service.
That is why service-level analysis requires multiple comparable jobs whenever possible.
Suppose five remodeling projects generally produce strong Gross Margins and finish close to estimate, while one project performs poorly because of an unusual site condition.
That weak project deserves investigation.
It does not necessarily mean remodeling is a weak service for the business.
Now suppose most of those remodeling projects repeatedly exceed estimated labor and finish below expected margin.
That is different.
You may be seeing a service-level pattern.
One project tells you how that project performed. Multiple comparable projects tell you more about how the service tends to perform.
Revenue Shows Volume, Not Service Profitability
Revenue is still useful.
It tells you how much business a particular service generates.
But it does not tell you how much of that revenue becomes Gross Profit.
Consider two services.
Service A generates substantially more revenue than Service B.
But Service A regularly requires aggressive pricing and experiences labor overruns that reduce its Gross Margin.
Service B generates less revenue but consistently produces stronger margins.
Service A may still generate more total Gross Profit because of its volume.
Or Service B may contribute more effectively relative to the resources required.
You need the financial results to know.
That is why revenue should be the beginning of service-level analysis rather than the conclusion.
Revenue tells you how much work a service produces. Profitability tells you what that work contributes.
Service profitability comes from the financial results of the jobs within that service. Labor, equipment, cash demands, Working Capital, and capacity provide additional context for deciding how well that service fits the business and whether it can be expanded effectively.
Those considerations should inform the decision without being confused with the profitability calculation itself.
Combine Job Results Within Each Service Category
Once meaningful service categories are established, organize the financial results of the jobs within each category.
Useful information may include:
- Revenue;
- actual job costs;
- Gross Profit;
- Gross Margin;
- estimated versus actual performance;
- cost variance;
- labor performance;
- equipment-related costs;
- recurring overruns.
Then compare the patterns.
Ask:
- Does this service consistently produce profitable jobs?
- Are Gross Margins relatively stable?
- Do jobs regularly finish close to estimate?
- Are actual costs routinely higher than expected?
- Do the same cost problems keep appearing?
- Is performance improving or deteriorating over time?
The purpose is not simply to add up a group of jobs.
It is to understand what the financial results reveal when similar work is viewed together.
Service profitability becomes visible when individual job results are organized by the type of work performed.
Consistency Helps You Understand What to Expect
A strong result is useful.
A repeatable strong result is more informative.
Suppose one service has completed four jobs.
One produced an unusually high Gross Margin. The other three produced much weaker results.
Another service has completed four jobs with slightly lower margins, but all four performed within a relatively consistent range.
Which service should receive more attention?
The answer depends on the circumstances, but the second pattern may tell you more about what the business can reasonably expect from future work.
That is why averages alone can be misleading.
A few unusually strong or weak projects can distort your impression of an entire service.
Look beyond the average and ask:
- Are the results reasonably consistent?
- How often does the service miss expectations?
- Are strong results common or unusual?
- Do the same financial problems recur?
- Can successful performance realistically be repeated?
You do not need complicated statistical analysis.
You need enough comparable financial information to distinguish an isolated result from a recurring pattern.
Understanding both the level and consistency of a service’s financial results helps you judge how much confidence to place in its past performance when making future decisions.
Repeated Cost Variance Can Reveal Service-Level Problems
Profitability tells you what happened financially.
Cost variance can help you understand why.
If the actual costs of a service repeatedly differ from what you estimated, look for patterns across the jobs.
You might discover that:
- labor routinely exceeds estimate;
- materials are regularly under-estimated;
- equipment usage is not fully anticipated;
- subcontractor costs vary significantly;
- mobilization costs are consistently missed;
- scope changes are not being captured effectively.
A variance does not automatically mean the service itself is bad.
The underlying issue might be:
- estimating;
- pricing;
- execution;
- scope management;
- cost tracking;
- or another correctable problem.
The distinction matters.
If a profitable service has an estimating problem, the appropriate response may be to improve estimating rather than reduce the service.
If the economics remain weak even after pricing and execution are understood, the decision may be different.
Repeated cost variance helps reveal whether weak service performance comes from correctable execution problems or something more fundamental about the work.
Some Services Use Labor More Efficiently Than Others
Labor can materially change the economics of a construction service.
Different types of work may require different:
- crew sizes;
- skill levels;
- supervision;
- setup time;
- travel;
- productivity;
- rework;
- scheduling flexibility.
A service may produce a reasonable Gross Margin but regularly require more labor hours than estimated.
Another may use crews more predictably and finish closer to planned labor.
Ask:
- Are labor hours predictable?
- Does this type of work regularly exceed estimated labor?
- Does it require specialized employees who are difficult to replace?
- Can crews perform the work efficiently?
- Does scheduling this service interfere with other profitable work?
The purpose is not to reduce every service decision to labor hours.
It is to understand whether the labor required to produce the financial result is reasonable and repeatable.
Labor intensity is part of understanding what a service actually contributes.
Equipment-Heavy Work May Require More Than the Margin Suggests
Equipment can create a similar issue.
Some services require little specialized equipment.
Others may depend on:
- owned equipment;
- rentals;
- specialized tools;
- transportation;
- fuel;
- maintenance;
- mobilization;
- equipment availability.
Those demands can affect both job costs and the company’s ability to perform more of the work.
Two services may produce similar Gross Margins while requiring very different equipment commitments.
That does not automatically make equipment-heavy work less attractive.
It means the margin should be considered in the context of what the business must provide to earn it.
If equipment-related costs are properly captured in job costs, do not subtract them again simply because you are evaluating the service.
The goal is not to manufacture a second profitability calculation.
The goal is to understand the financial and operational demands behind the reported result.
A Profitable Service Can Still Be Financially Demanding
Profitability and cash demands are related, but they are not the same thing.
A service can produce profitable jobs while requiring substantial cash before the company collects the revenue associated with them.
For example, some types of work may require:
- large material purchases;
- significant payroll before billing;
- subcontractor payments;
- equipment rentals;
- long billing cycles;
- retainage.
The business may therefore have to financially support the work for a meaningful period before receiving the cash associated with its profit.
Ask:
How much financial capacity does this service require before its profit becomes available as cash?
That question becomes especially important when considering whether to increase the amount of that work you perform.
A profitable service may still place significant demands on cash and Working Capital as volume grows.
That does not make the service unprofitable.
It provides important context for deciding how much of that work the business can support.
A Profitable Service Still Has to Fit the Business
Financial performance is important, but a construction company does not have unlimited capacity.
A service may produce attractive financial results while requiring resources the company cannot easily expand.
Consider:
- labor availability;
- management capacity;
- equipment capacity;
- scheduling;
- geographic reach;
- customer demand.
Suppose a specialized service consistently produces strong Gross Margins but depends on two highly skilled employees who are already fully scheduled.
The financial results may support continuing the service.
They do not automatically mean the company can double its volume.
Likewise, another profitable service may require equipment or Working Capital that limits how quickly the company can expand it.
The point is not to turn service profitability into a complete operations strategy.
It is to recognize that:
Financial attractiveness and practical capacity should be considered together before dramatically changing the service mix.
Evaluate Services Across the Same Financial Dimensions
You do not need one complicated service score to compare different types of work.
A more useful approach is to examine several financial dimensions consistently.
Profitability is the financial result. The other dimensions help you understand what it takes to produce, support, and repeat that result.
1. Revenue Contribution
Ask:
How much work does this service generate?
Revenue gives you scale.
It tells you how significant the service is to the volume of business you perform.
But revenue alone does not tell you whether the work is financially attractive.
2. Profitability
Ask:
What do the jobs within this service actually produce?
Review:
- Gross Profit;
- Gross Margin;
- Job Profitability.
This helps you understand what remains after the relevant job costs are considered.
3. Cost Performance
Ask:
Do these jobs perform financially the way we expected?
Review:
- estimated versus actual results;
- Cost Variance;
- recurring labor overruns;
- recurring material overruns;
- equipment-related differences;
- other repeated cost problems.
This can help identify why a service performs the way it does.
4. Resource and Financial Demand
Ask:
What does the business have to commit to perform this service?
Consider:
- labor;
- equipment;
- cash;
- Working Capital;
- other meaningful capacity requirements.
The purpose is not to subtract costs twice.
It is to understand what producing and scaling the work requires.
5. Consistency
Ask:
How repeatable are the results?
Look across multiple comparable jobs.
A service that regularly produces understandable results may be easier to plan around than one whose financial performance varies dramatically from project to project.
The goal is not to calculate an artificial service score.
The goal is to see the economics of each type of work more completely.
No single measure determines which service contributes most effectively to the business.
Compare Services Using the Same Questions
Once job results are organized into meaningful service categories, compare those categories using the same financial questions.
Service question |
What to review |
|---|---|
| How much work does it generate? | Revenue |
| Is the work profitable? | Gross Profit, Gross Margin, Job Profitability |
| Do jobs perform as expected? | Estimated vs. actual results, Cost Variance |
| How labor-intensive is it? | Labor hours, labor cost, productivity |
| What equipment does it require? | Equipment costs, rentals, mobilization |
| How much financial capacity does it require? | Cash demands, Working Capital |
| Are the results consistent? | Performance patterns across multiple jobs |
This is not a scorecard.
There is no universal formula that says:
Revenue + Margin + Labor + Equipment + Consistency = Best Service
Different construction businesses have different:
- cost structures;
- crews;
- equipment;
- capacity;
- markets;
- margins;
- cash positions;
- service mixes.
Using the same questions gives you a consistent way to compare the work without pretending every dimension can be reduced to one number.
No Single Number Identifies Your Best Service
Once you have service-level financial information, it can be tempting to find one number and let it make the decision.
Most revenue wins.
Highest Gross Margin wins.
Lowest labor cost wins.
Lowest equipment requirement wins.
But each measure answers a different question.
A high-margin service may produce very little total Gross Profit because the company performs only a small amount of it.
A high-revenue service may produce substantial Gross Profit despite a lower margin.
A service with excellent historical margins may be difficult to expand because it requires specialized labor.
A service with strong average results may also be highly inconsistent from job to job.
That is why service-level Financial Visibility requires context.
The strongest service mix comes from understanding several financial dimensions together—not choosing a winner from one metric.
What Should You Do With What You Learn?
The purpose of service-profitability analysis is not to create a list of good services and bad services.
It is to make better decisions about what your company offers and where it focuses its capacity.
The financial patterns may suggest that a service deserves to be:
Emphasized
A service consistently produces strong financial results and fits the company’s capacity.
That may justify pursuing more of the work.
Improved
The underlying service appears viable, but recurring estimating, cost-control, scheduling, or execution problems are reducing performance.
The opportunity may be to fix the process rather than reduce the work.
Repriced
The company can perform the service effectively, but current pricing does not adequately reflect the cost or demands of the work.
Better pricing may change the financial result.
Reduced
The service may remain worthwhile in certain circumstances but consume more capacity or financial resources than the business wants to dedicate to it.
The answer may be greater selectivity rather than complete elimination.
Discontinued
Some services may repeatedly produce weak results even after the causes are understood and realistic improvements are considered.
In that case, the company may decide its people, equipment, cash, and management attention can be used more effectively elsewhere.
None of these decisions should happen automatically because one number crossed a threshold.
The analysis informs the decision. It does not create an automatic rule.
Job Selection and Service Profitability Are Related—but Different
Individual job selection and service profitability overlap, but they answer different questions.
Job-selection analysis asks:
Should we keep pursuing this kind of job under these conditions?
Service-profitability analysis asks:
Across the jobs in this service category, what does this type of work contribute to the business?
That distinction matters.
A service may be financially strong overall while containing certain jobs you should stop pursuing.
Perhaps:
- small projects perform poorly while larger projects perform well;
- jobs outside your normal geographic area create excessive travel costs;
- projects below a certain scope are difficult to execute efficiently;
- certain contract structures consistently weaken performance.
That does not necessarily mean the entire service should disappear.
Likewise, several individual jobs may appear acceptable on their own while the broader service consistently consumes more labor, equipment, cash, or management capacity than expected.
Looking at both levels gives you better information.
Customer Profitability and Service Profitability Use Different Groupings
Customer profitability provides another useful comparison.
Customer analysis groups financial results around:
Who gave us the work?
Service analysis groups financial results around:
What kind of work did we perform?
The same project may appear in both analyses.
Suppose you complete remodeling projects for several different customers.
Customer-level analysis can help you understand which customer relationships contribute most effectively.
Service-level analysis can help you understand how remodeling performs across those customers.
Those are different questions.
A strong customer may give you several different kinds of work with very different financial results.
A strong service may perform well across several different customers.
Organizing the same underlying job information in different ways creates different kinds of Financial Visibility.
Which Financial Information Helps You Evaluate Services?
You do not need every financial report to begin evaluating service profitability.
You need reliable job-level information and enough broader financial context to interpret what those jobs are producing.
Job Performance Report
A Job Performance Report can provide evidence such as:
- Revenue;
- actual job costs;
- Gross Profit;
- Gross Margin;
- estimated versus actual performance;
- cost variance.
When jobs are consistently identified by service or type of work, those results can be grouped and compared.
That allows individual project results to become service-level information.
Profit & Loss Statement
The Profit & Loss Statement provides broader company context.
It helps show the overall Revenue, Gross Profit, and expenses of the business during a period.
But a standard P&L does not automatically tell you which service is most profitable.
That depends on how your accounting information is organized and whether service-level activity can be identified reliably.
The Job Performance Report helps answer:
How did the jobs within this service perform?
The P&L helps provide context for:
What is happening in the business overall?
Neither should be asked to answer a question it was not designed to answer.
Financial Visibility Makes Service Profitability Easier to Understand
Service-level decisions depend on financial information being captured and organized so that comparable work can be evaluated together.
The process follows the Construction Visibility System™:
Capture → Organize → Analyze → Report → Advise
Capture
Record the financial activity associated with each job accurately.
That may include:
- Revenue;
- labor;
- materials;
- subcontractors;
- equipment;
- other relevant job costs.
Organize
Connect job activity to meaningful service or type-of-work categories.
Consistent organization is what allows similar projects to be evaluated together.
Analyze
Compare:
- profitability;
- Gross Margin;
- cost variance;
- labor performance;
- equipment demands;
- cash demands;
- consistency
across the service categories.
Report
Use job-performance information and service-level summaries to make those patterns visible.
Advise
Use that Financial Visibility to decide where the business may want to:
- emphasize;
- improve;
- reprice;
- reduce;
- discontinue.
This is how bookkeeping moves beyond recording job transactions.
The same underlying financial information can help a construction business understand individual jobs, customer relationships, and the services that make up its overall mix of work.
Frequently Asked Questions
How do I know which construction services are the most profitable?
Start by grouping comparable jobs by service or type of work.
Then review the Revenue, Gross Profit, Gross Margin, Job Profitability, estimated versus actual performance, and recurring cost patterns across the jobs in each category.
Add context from labor, equipment, cash demands, Working Capital, and consistency.
The service generating the most revenue is not automatically the service contributing most effectively to the business.
Is the service with the most revenue always the most profitable?
No.
Revenue tells you how much work the service generates.
It does not tell you how much Gross Profit the work produces, whether margins are strong, whether costs consistently exceed estimate, or what financial resources are required to perform the work.
A lower-revenue service may produce stronger financial results.
How do I calculate profitability by service?
At a basic level, consistently identify jobs by service or type of work and organize the relevant Revenue and job costs within those categories.
Then review Gross Profit and Gross Margin across the jobs in each service.
The calculation should be supported by accurate job costing and consistent classification. Labor, equipment, cost variance, cash demands, and consistency provide additional context when evaluating what the service contributes.
How many jobs should I review before judging a service?
There is no universal number.
You need enough comparable jobs to determine whether the financial result appears to be an isolated event or a meaningful pattern.
A single unusual project should not automatically define an entire service.
The more varied the work within a category, the more carefully you should consider whether the jobs are truly comparable.
Should labor and equipment affect how I evaluate a service?
Yes.
Labor and equipment can affect job costs, capacity, predictability, and the company’s ability to perform more of the work.
If those costs are already included in job costs, do not subtract them again.
Instead, use the information to understand what resources are required to produce the reported financial result.
Can a profitable service still be bad for cash flow?
Yes.
A service can produce profitable jobs while requiring large material purchases, significant payroll, subcontractor payments, equipment costs, long billing cycles, or retainage before the related cash is collected.
That does not change the profitability already produced.
It changes the financial demands associated with performing and potentially expanding that type of work.
Should I stop offering a service that is less profitable?
Not automatically.
First determine why the service is producing weaker results.
The issue may involve:
- pricing;
- estimating;
- labor performance;
- equipment costs;
- execution;
- project selection;
- scope management;
- capacity.
Some problems may be correctable.
Others may reveal that the service does not fit the business as well as other opportunities.
The purpose of service-profitability analysis is to understand the financial evidence well enough to make that distinction.
Compare Services by the Financial Results They Produce
Use this resource to compare the financial performance of different services and identify which types of work are contributing the most value to your construction business.
Better Service-Mix Decisions Start With Better Financial Visibility
A service can generate a lot of revenue.
It can keep crews busy.
It can fill the schedule.
And it can still contribute less effectively than another type of work.
That is why service-level decisions require more than activity.
Look at Revenue.
Look at Gross Profit and Gross Margin.
Look at estimated versus actual costs.
Look at labor.
Look at equipment.
Look at cash and Working Capital demands.
Look at consistency across multiple jobs.
Then look at those factors together.
You are not trying to identify the universally “best” construction service.
There is no universal answer.
You are trying to understand which types of work make the most sense for your business, based on your actual financial results and the resources required to produce them.
That Financial Visibility can help you recognize:
- services that consistently produce strong financial results;
- services where pricing or estimating deserves attention;
- services where labor or equipment demands need investigation;
- services that create significant financial demands;
- services that may deserve greater emphasis;
- services that may need improvement, repricing, reduced emphasis, or reconsideration.
The purpose is not to stay busy at any cost.
It is to understand what your different types of work are actually contributing so you can make better decisions about where to focus the company’s people, equipment, cash, and capacity.
Schmidt Bookkeeping helps construction business owners organize job-level financial information so they can see which types of work are contributing most effectively to the business and make better decisions about where to focus their capacity.